
Last Updated on December 25, 2025
Singapore districts and regions form the foundation for analyzing, pricing, and comparing the local property market. Buyers, developers, agents, and government bodies rely on a few established frameworks to describe location, market behaviour, and long-term value.
As a result, three main systems appear most often in listings and market reports. In practice, each framework serves a different purpose. While some explain geography, others help compare pricing behaviour and long-term market performance across Singapore regions.
- By planning regions: North, North-East, Central, East, and West
- By market segments:
- Core Central Region (CCR)
- Rest of Central Region (RCR)
- Outside Central Region (OCR)
- By the 28 postal districts
Buyers comparing Singapore property districts typically start with these categories, then refine their shortlist using factors such as schools, MRT access, amenities, and lifestyle needs. For a longer-term context, many also factor in property market cycles and property asset progression when assessing timing and strategy.
Singapore by Planning Regions
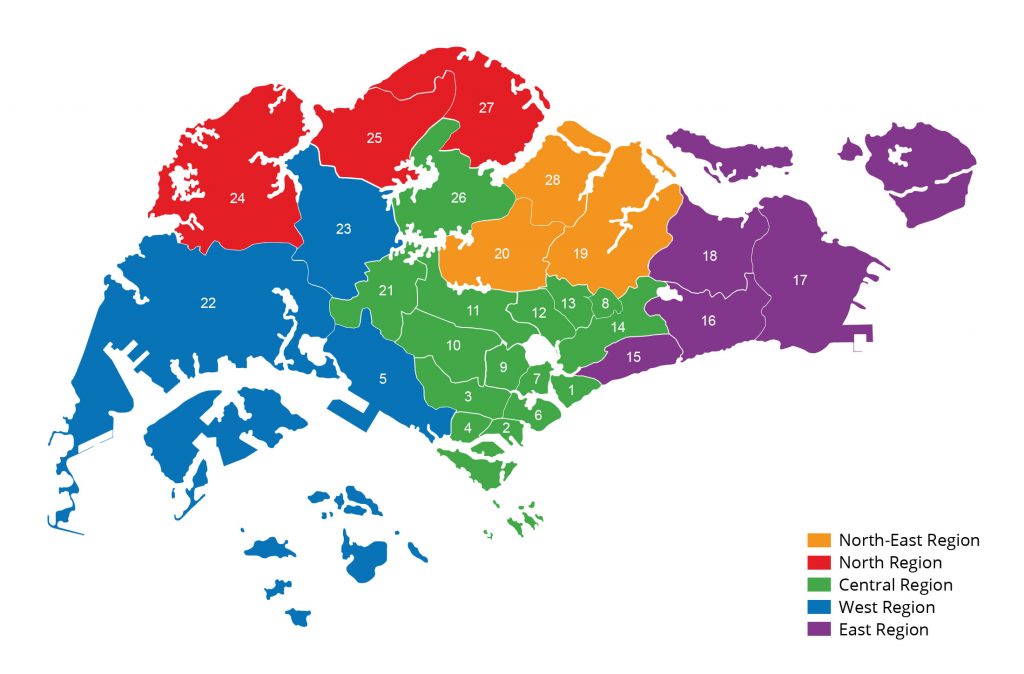
First, when analyzing Singapore’s districts and regions from a planning perspective, the Urban Redevelopment Authority (URA) applies a five-region framework to organize land use and infrastructure development. Planning and land-use guidance follows the gazetted Master Plan 2025 (December 1, 2025), which continues to organize Singapore into the North, North-East, Central, East, and West planning regions.
Importantly, URA uses this structure to guide urban planning, infrastructure rollout, and population distribution. Therefore, buyers rarely rely on planning regions for direct property price comparisons, even though the framework helps explain how Singapore regions evolve over time.
Singapore by Postal Districts
In addition, Singapore districts and regions are commonly described using the 28 legacy property districts, which correspond to ranges of postal sectors (the first two digits of six‑digit postcodes). Singapore Post administers the six‑digit postcode system; districts are no longer used by SingPost, but remain a familiar shorthand in property listings and transactions.
For example, buyers often see postal districts when browsing listings, reviewing historical transactions, or identifying neighbourhoods. However, districts focus on location identity rather than market behaviour, so most buyers pair them with Singapore market segments when comparing prices.
| Postal District | Postal Sector (1st 2 digits of 6-digit postal codes) | General Location |
| 01 | 01, 02, 03, 04, 05, 06 | Raffles Place, Cecil, Marina, People’s Park |
| 02 | 07, 08 | Anson, Tanjong Pagar |
| 03 | 14, 15, 16 | Queenstown, Tiong Bahru |
| 04 | 09, 10 | Telok Blangah, Harbourfront |
| 05 | 11, 12, 13 | Pasir Panjang, Hong Leong Garden, Clementi New Town |
| 06 | 17 | High Street, Beach Road (part) |
| 07 | 18, 19 | Middle Road, Golden Mile |
| 08 | 20, 21 | Little India |
| 09 | 22, 23 | Orchard, Cairnhill, River Valley |
| 10 | 24, 25, 26, 27 | Ardmore, Bukit Timah, Holland Road, Tanglin |
| 11 | 28, 29, 30 | Watten Estate, Novena, Thomson |
| 12 | 31, 32, 33 | Balestier, Toa Payoh, Serangoon |
| 13 | 34, 35, 36, 37 | Macpherson, Braddell |
| 14 | 38, 39, 40, 41 | Geylang, Eunos |
| 15 | 42, 43, 44, 45 | Katong, Joo Chiat, Amber Road |
| 16 | 46, 47, 48 | Bedok, Upper East Coast, Eastwood, Kew Drive |
| 17 | 49, 50, 81 | Loyang, Changi |
| 18 | 51, 52 | Tampines, Pasir Ris |
| 19 | 53, 54, 55, 82 | Serangoon Garden, Hougang, Punggol |
| 20 | 56, 57 | Bishan, Ang Mo Kio |
| 21 | 58, 59 | Upper Bukit Timah, Clementi Park, Ulu Pandan |
| 22 | 60, 61, 62, 63, 64 | Jurong |
| 23 | 65, 66, 67, 68 | Hillview, Dairy Farm, Bukit Panjang, Choa Chu Kang |
| 24 | 69, 70, 71 | Lim Chu Kang, Tengah |
| 25 | 72, 73 | Kranji, Woodgrove |
| 26 | 77, 78 | Upper Thomson, Springleaf |
| 27 | 75, 76 | Yishun, Sembawang |
| 28 | 79, 80 | Seletar |
For an official reference, you can also check Singapore Post, which maintains postal code information used for address identification across Singapore districts.
Singapore by Market Segments (CCR, RCR, OCR)
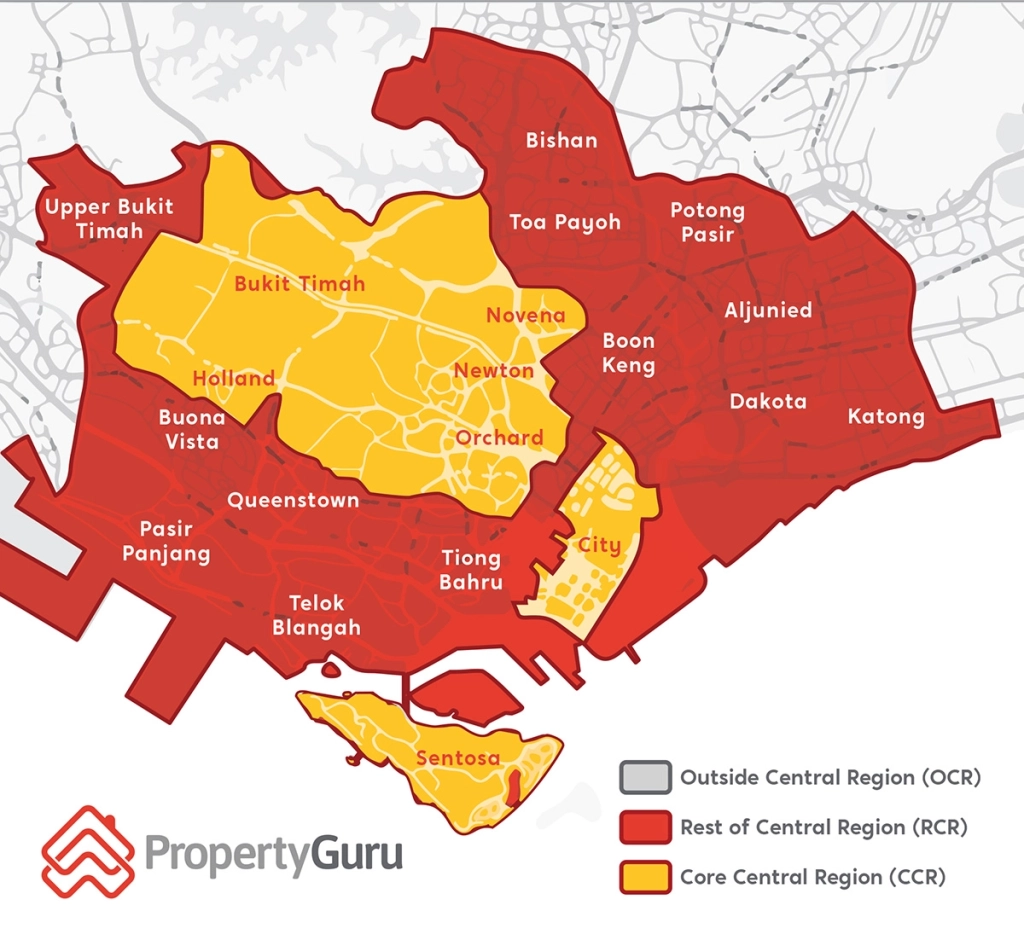
For pricing and performance analysis, Singapore districts and regions are most often grouped into three market segments: Core Central Region (CCR), Rest of Central Region (RCR), and Outside Central Region (OCR). Therefore, buyers commonly use these Singapore market segments when comparing price levels and transaction trends.
Because URA designed this framework for consistent comparison, CCR, RCR, and OCR frequently appear in URA reports, bank valuations, developer pricing strategies, and market commentary. Consequently, most discussions about Singapore property districts and price gaps rely on this segmentation.
The Urban Redevelopment Authority publishes official updates and reports that support CCR, RCR, and OCR comparisons. For more details, please visit the URA website.
| Segment | Districts | General Coverage | Typical Price Range |
| CCR | Postal Districts 9, 10, 11, the Downtown Core Planning Area, and Sentosa | Orchard, Somerset, River Valley, Tanglin, Bukit Timah, Holland, Newton, Novena, plus Downtown Core and Sentosa | $$–$$$ |
| RCR | Areas within the Central Region that are outside the CCR | City-fringe and central neighbourhoods outside CCR, e.g., Queenstown, Alexandra, Tiong Bahru, Rochor, Balestier, East Coast, Thomson | $–$$$ |
| OCR | Areas outside the Central Region | Suburban and heartland locations island-wide | $–$$ |
How People Use Singapore Districts and Regions
Traditionally, prices moderate as locations move from the Core Central Region to the Rest of Central Region, and then outward to the Outside Central Region. However, the price gap between these Singapore regions has narrowed in recent years. Recent data show clear narrowing: in Q1 2025, the median $psf gap for new non‑landed homes between CCR and RCR was about 1.0%, and the CCR–OCR gap was about 16.3% based on market analysis of URA Realis transactions.
Specifically, improved transport connectivity, decentralised employment hubs, and sustained suburban demand have reshaped buyer preferences. As a result, buyers evaluate value using more than just proximity to the city centre.
In practice, factors such as accessibility, amenities, schools, green spaces, and overall liveability are increasingly shaping decisions across Singapore’s districts and regions.
Ultimately, understanding Singapore districts and regions helps buyers compare prices, assess risk, and identify opportunities across different parts of the island.